Analyze Deliveries
In this section we present an overview of how to analyze the delivery statistics.
Two menu-options are provided to perform analysis on delivery statistics:
- For deliveries to the Logical Validation Layer
- For deliveries from the File Export Layer
Both analysis options offer similar functionality. Doing analysis is important to support the process of continuous improvement of your information delivery process.
Aggregated delivery statistics overview
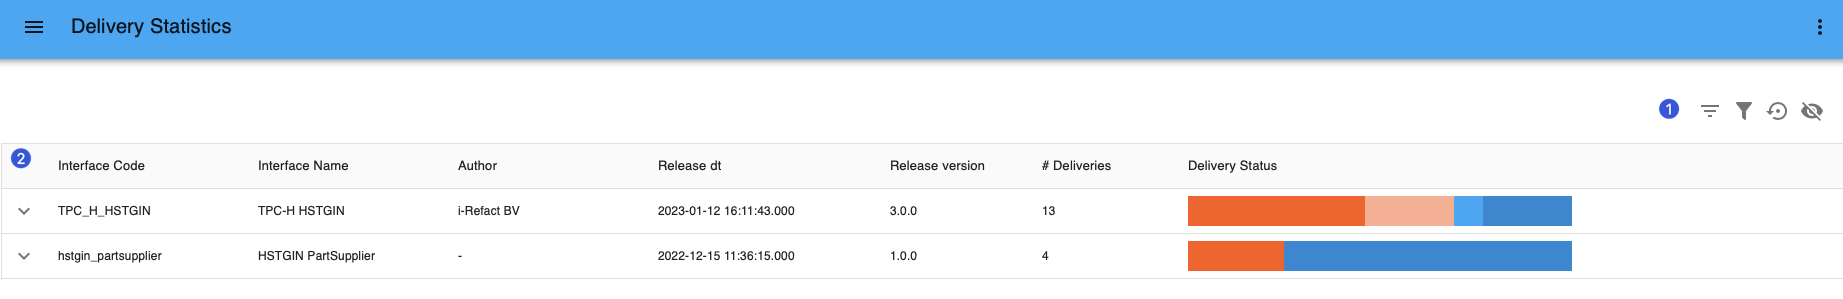
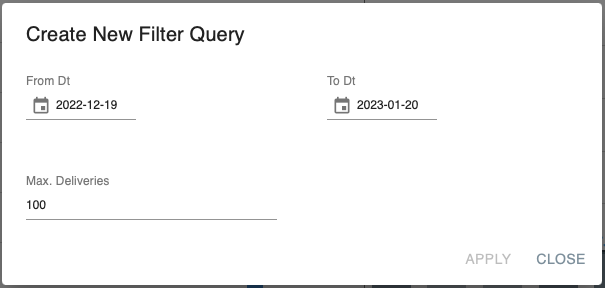
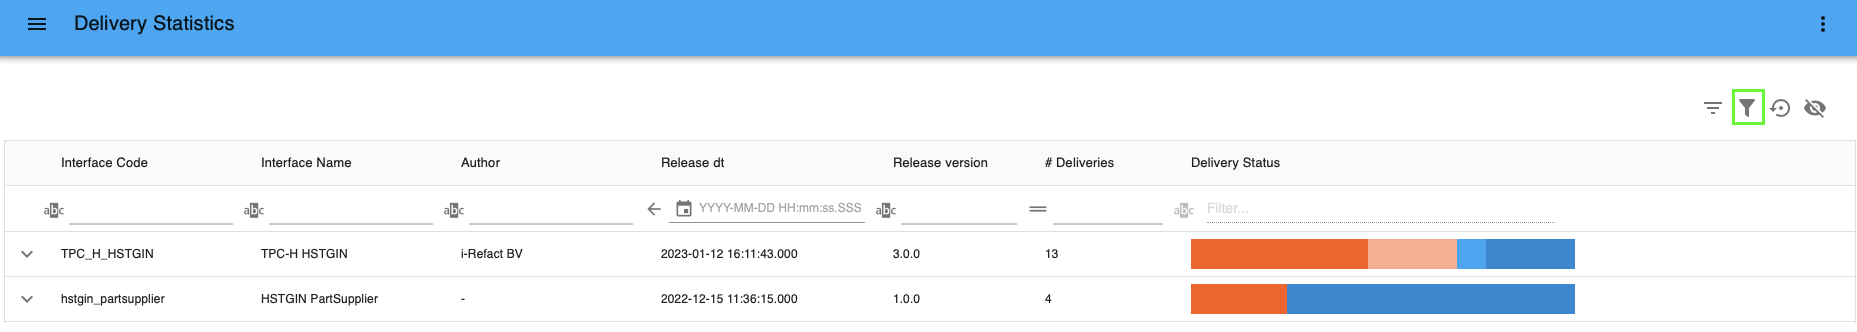
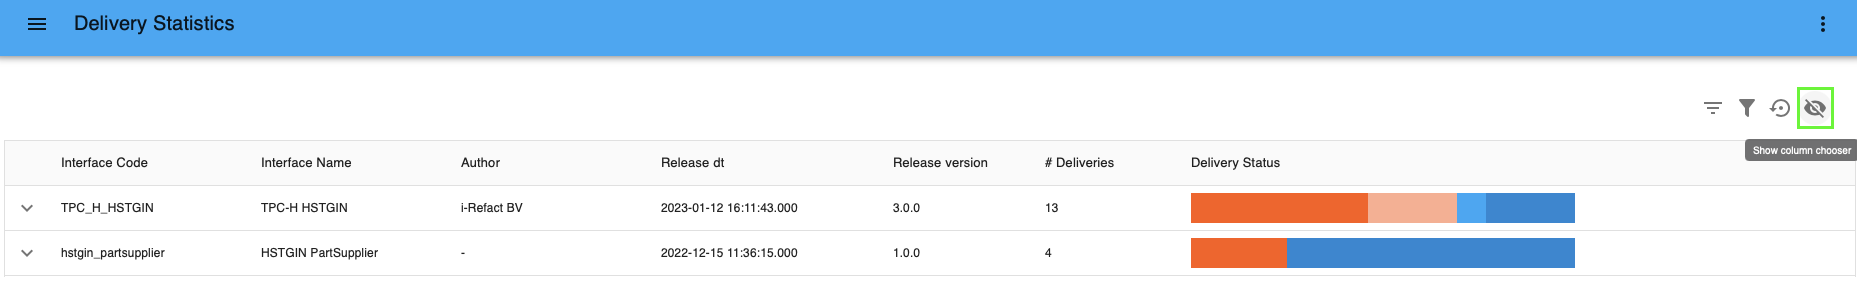
If you click on Delivery Statistics in the menu, you get an overview of the delivery statistics aggregated on the level of logical interface. A list of logical interfaces that hold the last 100 deliveries from the last 30 days is shown.
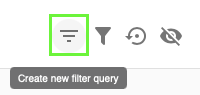
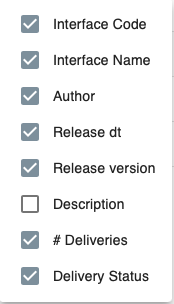
Click on the icons on the right to (1):
For each logical interface (2) you can see the the version number of the interface (this number corresponds to the model version in the Logical Validation Model), status of the interface, total number of deliveries (#Deliveries), and a summary overview of related delivery statuses.
Delivery statistics overview for one logical interface
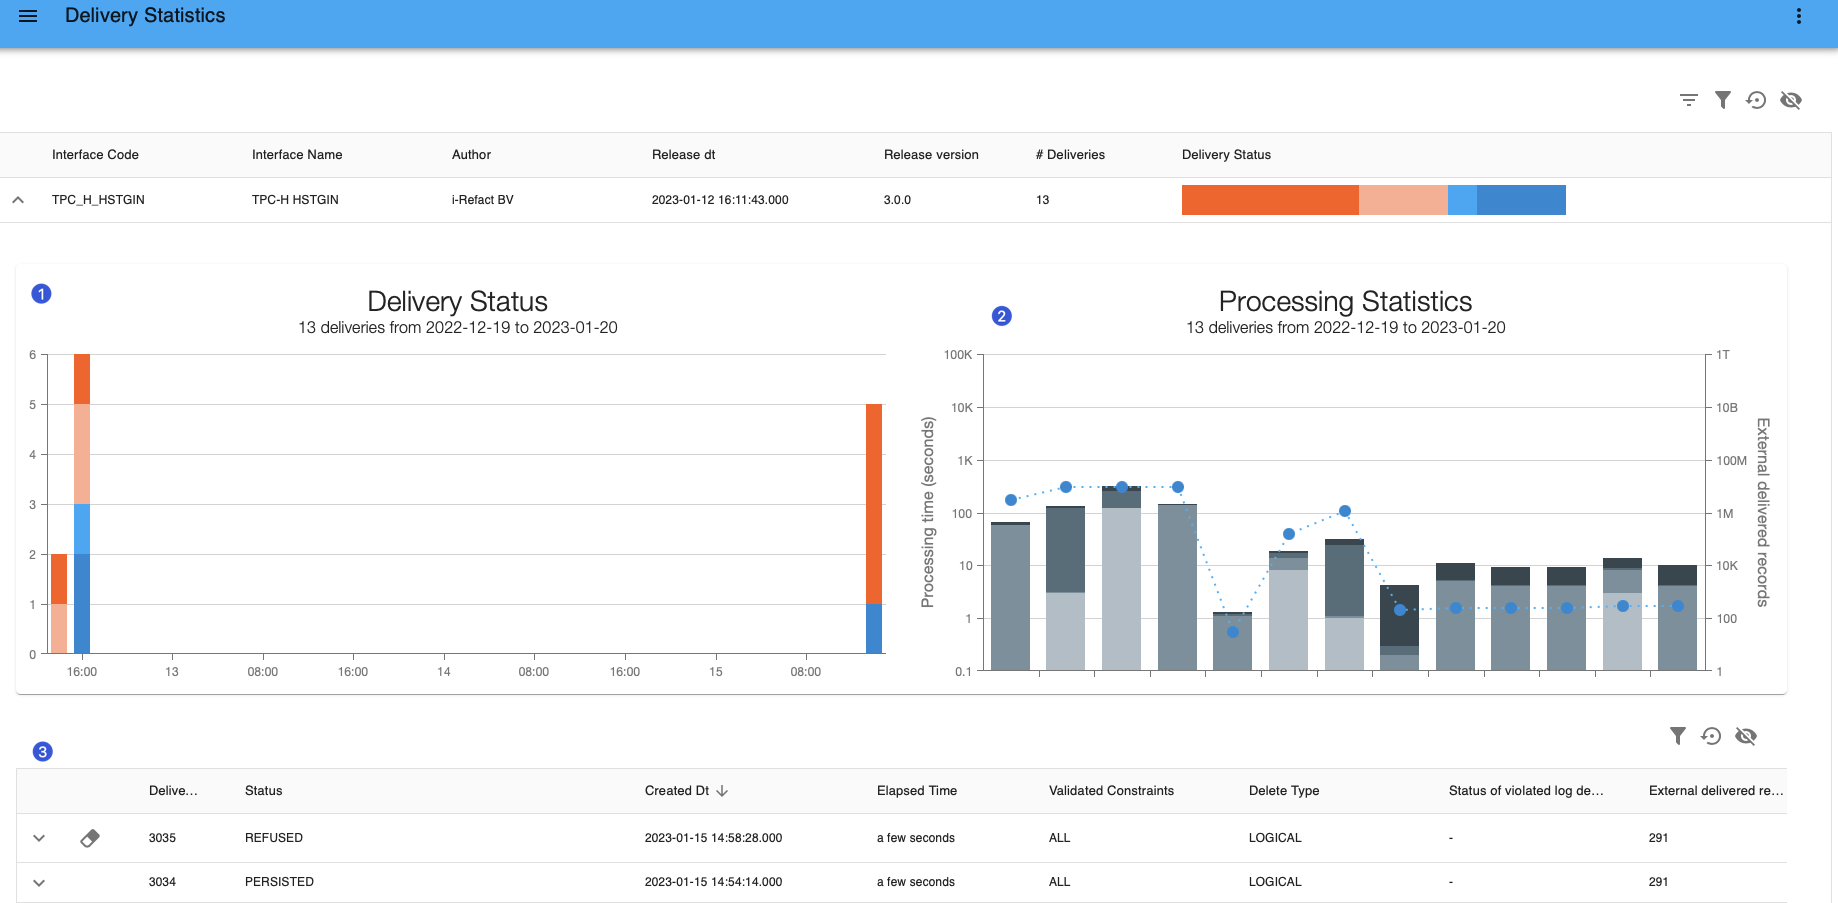
Click on the downward arrow to expand on the details of an interface. You can see:
- A graphical representation
(1)of the end-state of the deliveries on their delivery date. It is represented by a stacked bar over time. Different end status's of deliveries have different colors. By hovering over the bars, you can see more detailed information. - A graphical representation
(2)of the run-times per layer per delivery (primary axis) and the corresponding number of records externally delivered (secondary axis). Axis are exponential. The colors represent the different layers the data runs through. - The details of deliveries
(3)in the selected period are displayed below graphs. For example, you can see the elapsed time between receiving the delivery and reaching an end-state. You can expand on the details of one delivery.
Detailed overview of one delivery
If you expand a delivery by pressing on the downward arrow, the details of the delivery are provided and organized in three tabs:
- Constraint violations (only for deliveries to the Logical Validation Layer)
- Task runs
- Entity updates
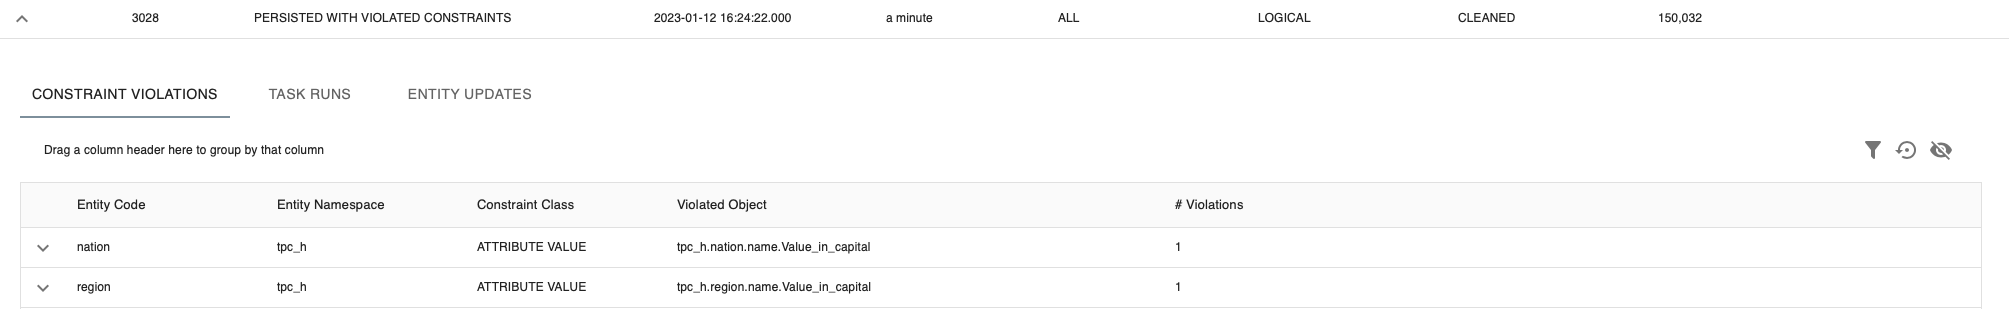
1. Constraint violations results
The first tab shows the statistical information about delivery constraint validation results. It is empty when no violations are registered. If constraint violations have occurred, the results can include up to 5 sample records to help you understand why the violation has occurred.
The set of violated records is ordered: i-refactory will first show the records with the most violated constraints.
For each constraint the following statistics are reported :
- The total count of violations (
# Violations) - The treshold value applicable at the time the delivery was processed (
# Treshold) - Indicator of the total count of violations exceeded the treshold value (
Treshold exceeded)
The Validation Threshold settings as defined in the Constraint Settings determine from what number of validation errors the Delivery will be rejected. The Validation Action settings are executed when an error is found.
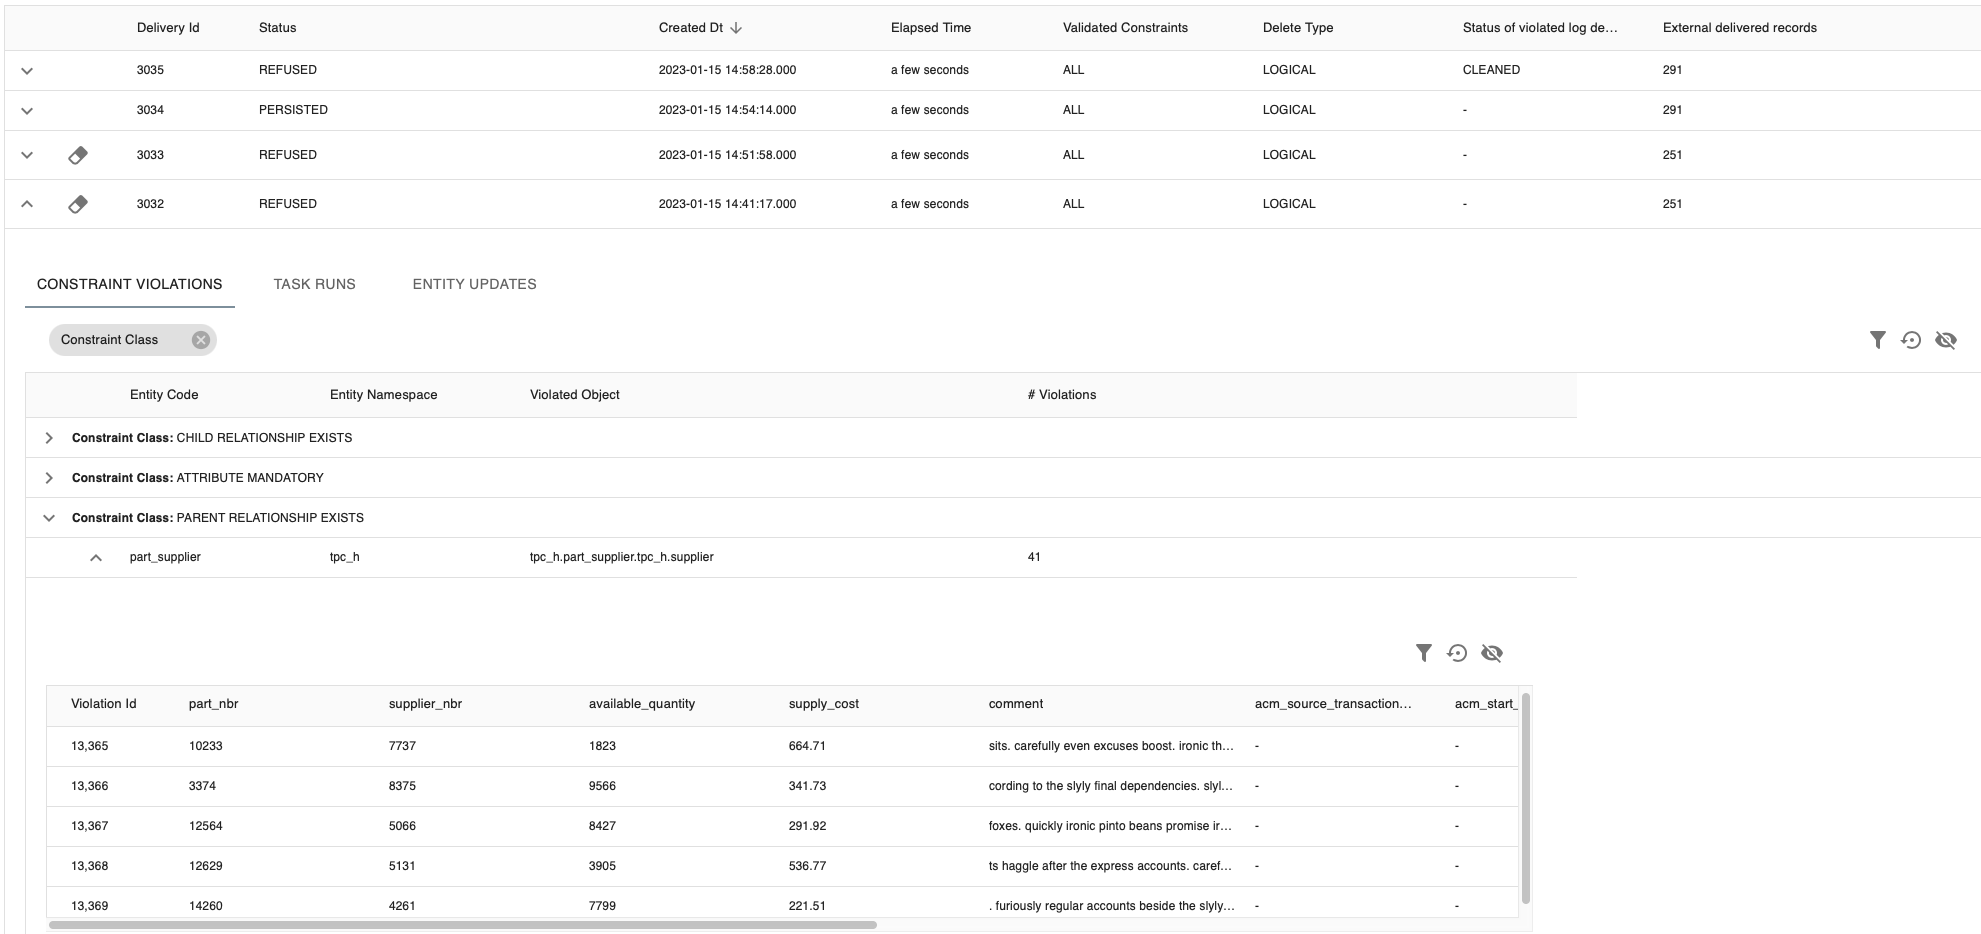
{tip} For deliveries that are REFUSED it is good practice to group by
Treshold exceededindicator. For all other cases you can group by theConstraint Class. This helps you analyze violations in the most effective manner.
Clean the violated constraint log
For a completed delivery you can physically delete all registered logging in violatedRecord and violatedConstraint. The log of violations counts per constraint will not be removed.
- Click on the icon
cleanup.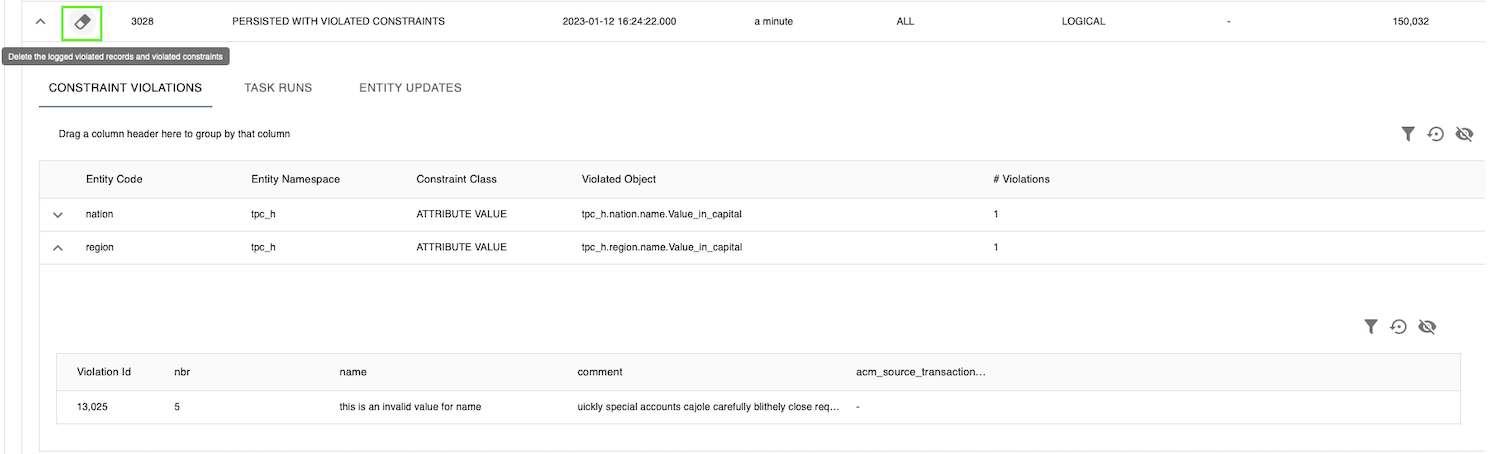
Cleanup - A popup window appears. Check the delivery id and click on
Clear log. This will also clean theviolated_recordandviolated_constraintslog in the database for this specific delivery id.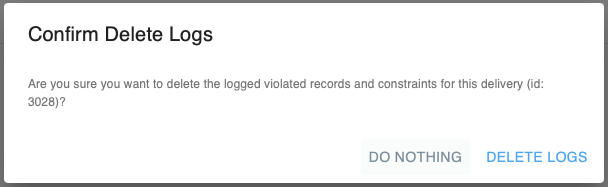
Confirmation window - If you refresh the screen, you will no longer see the violated records.
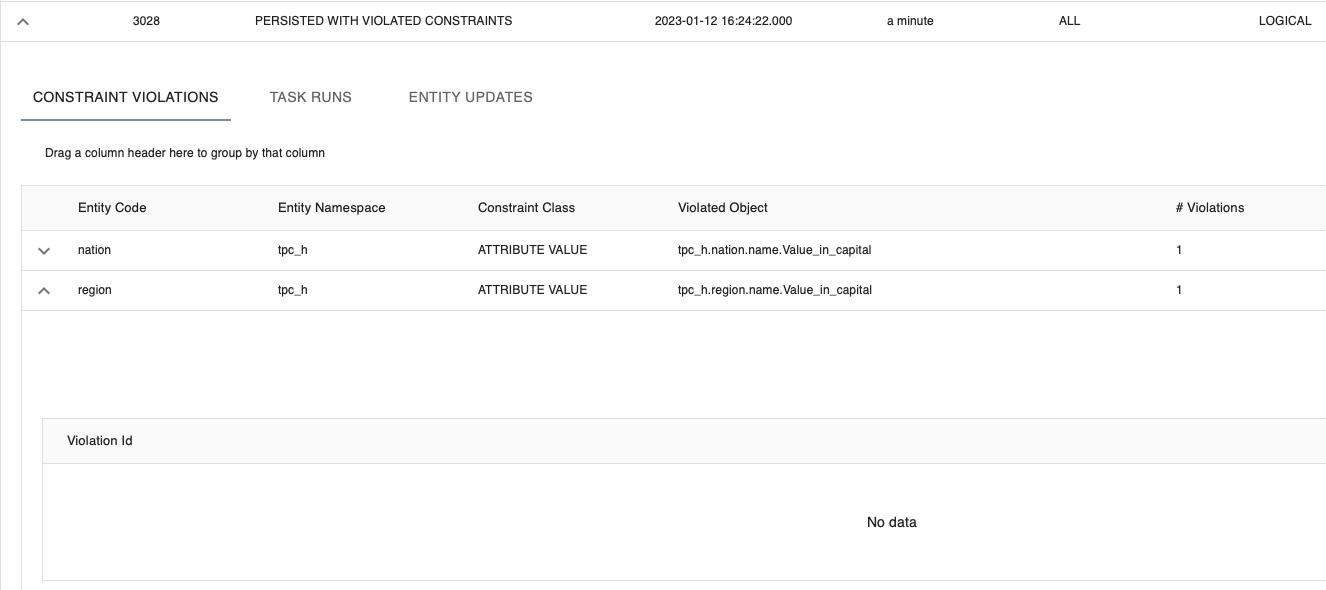
After cleanup
{info} You need to have the role of
DataManagerto be able to clean the log. In the API the propertydelivery.logCleanupInfowill register the status of the cleanup process. In the database you can find thelog_cleanup_infoattribute inacm_datadel.delivery.
2. Task runs
The second tab in the detailed overview of a delivery, shows the task runs with statistics per layer per task. You can expand on each task and see which query is executed, the status of the task, how many records are processed, and how long it took (duration).
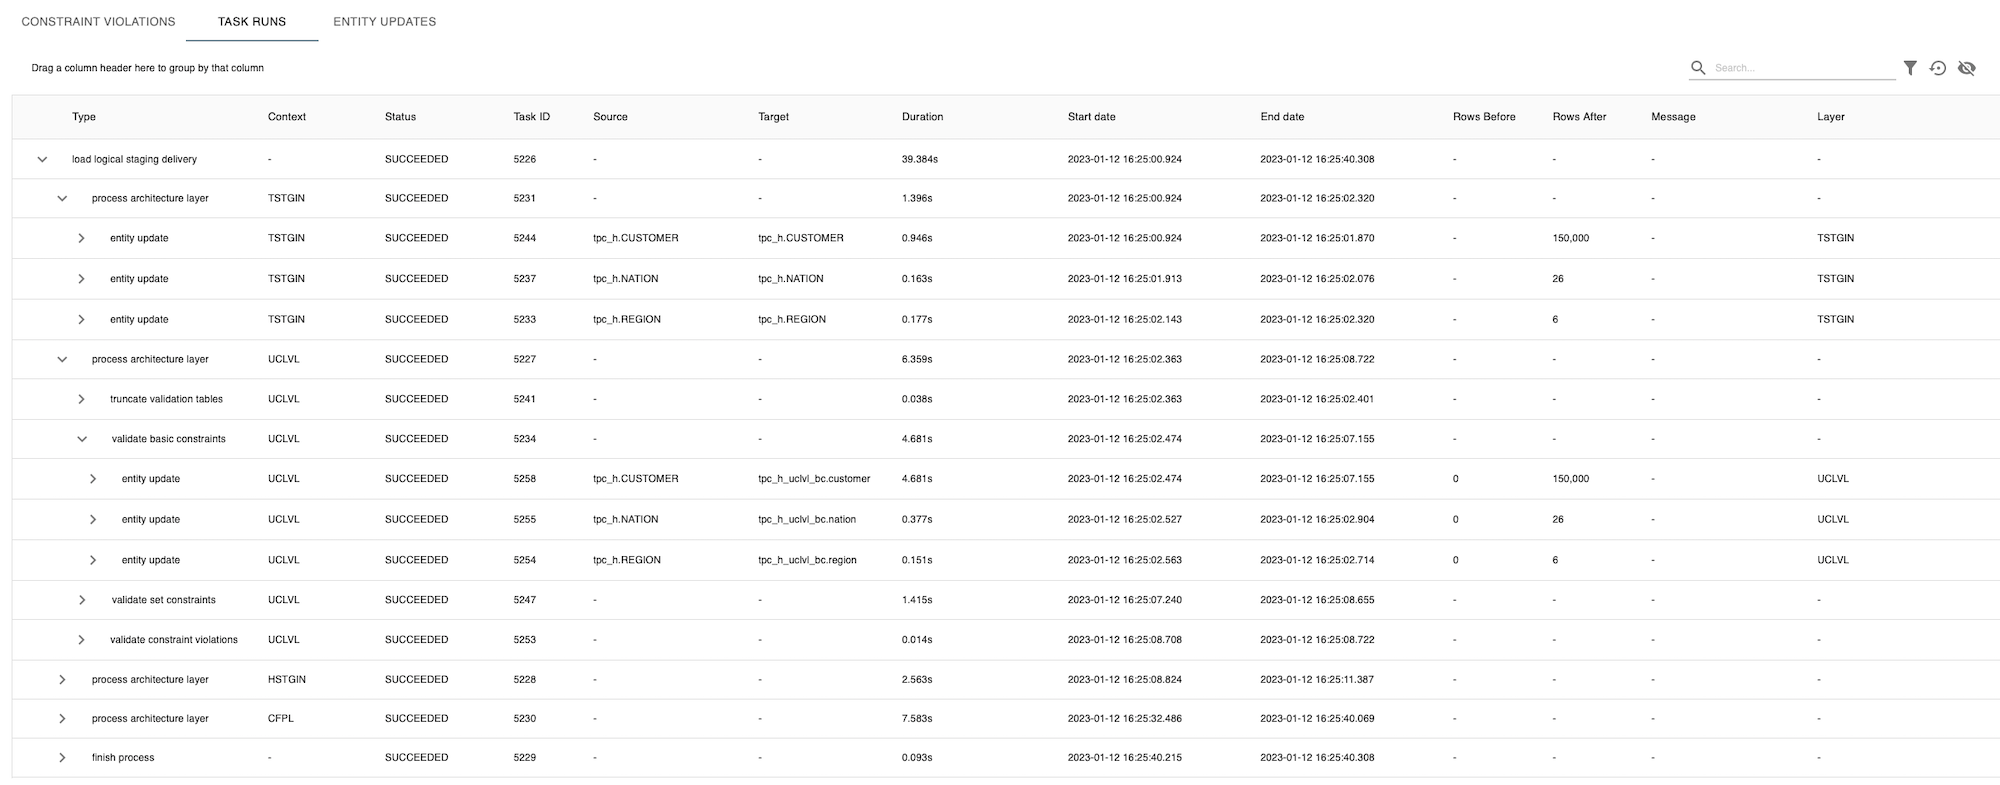
{note} For deliveries from the File Export Layer, each Entity Update is represented by one Task and therefore you will see no difference when comparing details of Task runs and Entity updates.
3. Entity updates
The third tab in the detailed overview of a delivery, shows the entity updates with statistics per layer per task. You can expand on each entity update and see which query is executed. This helps you to understand which entities are updated, how many records are processed, and how long it took (duration). We advise to use Layer to group the updates visually togehter, but you are free to select additional or new column(s).
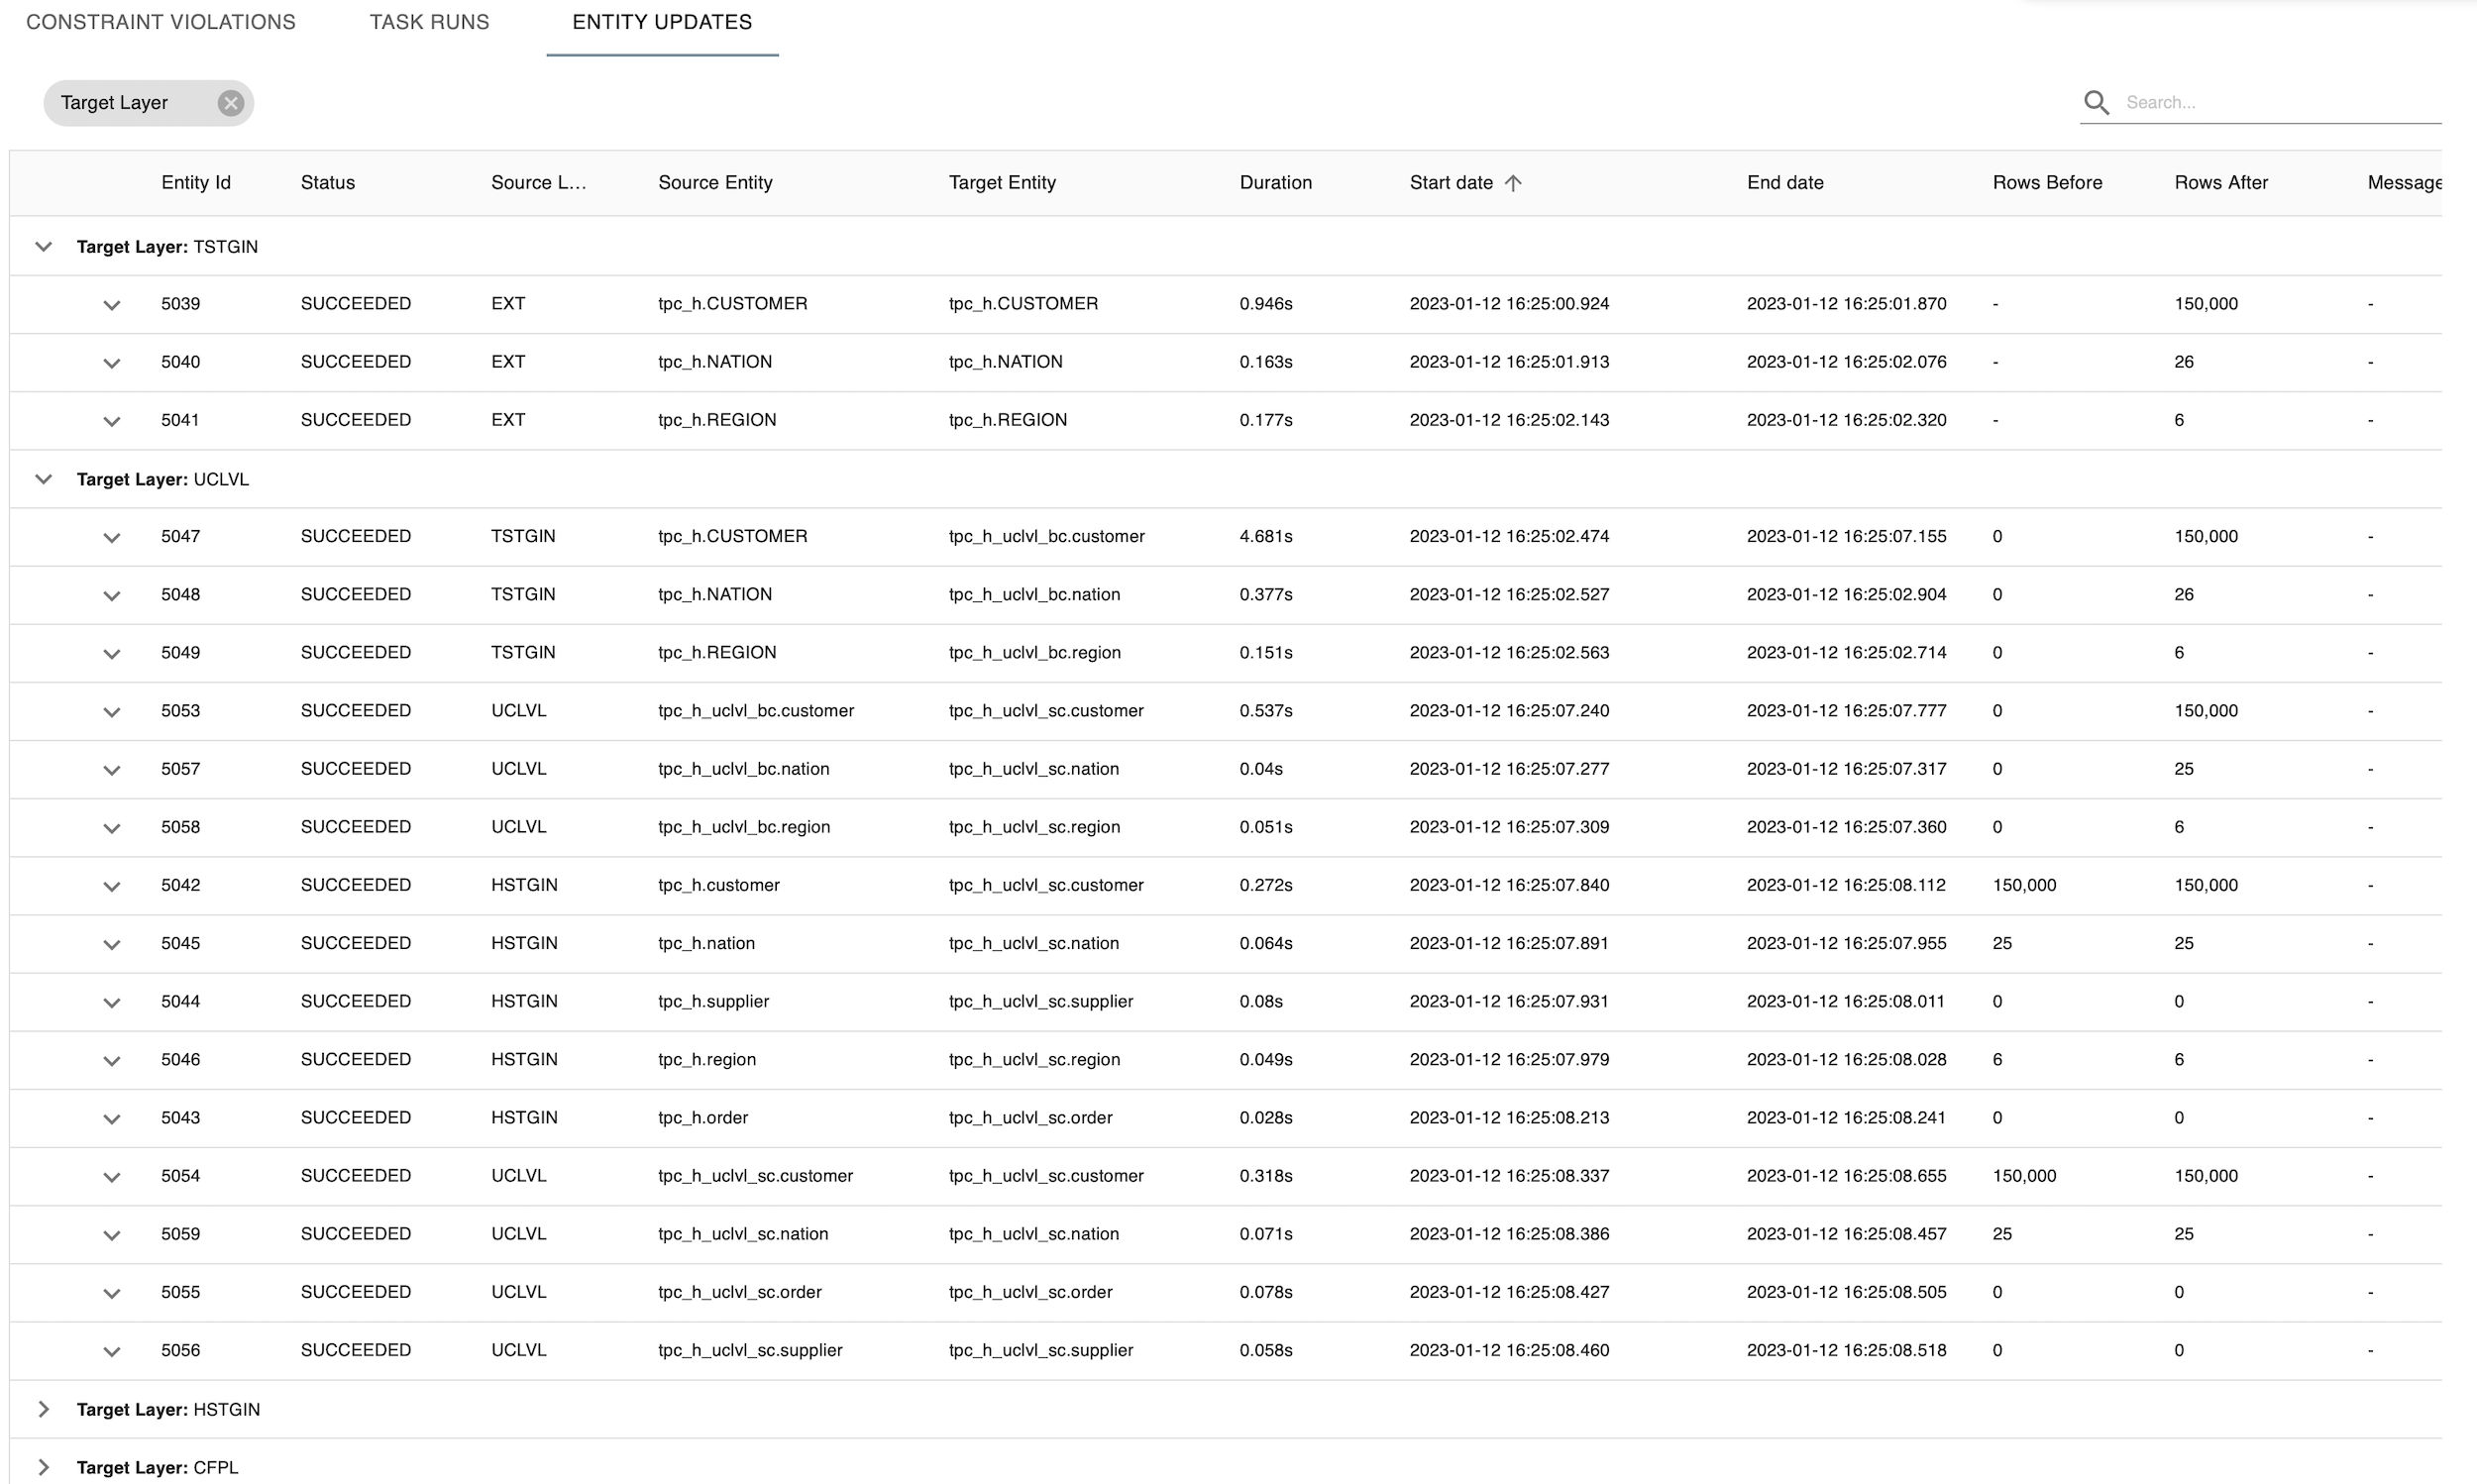
{note} Please note tasks are executed in parallel so duration only represents duration of the task and cannot be aggregated.
What's next?
- Check the overview
Upgrade model version
After you have changed the data model, you need to update the data model version. This way, you can keep track of the model releases.
- Select
Model > Properties.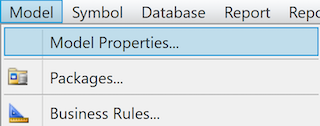
Menu Model Properties - or right click on the white canvas and select
Model Properties.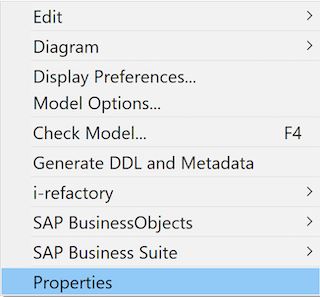
Context menu Model Properties - The
Model Propertieswindow opens. Change the version number next toVersion.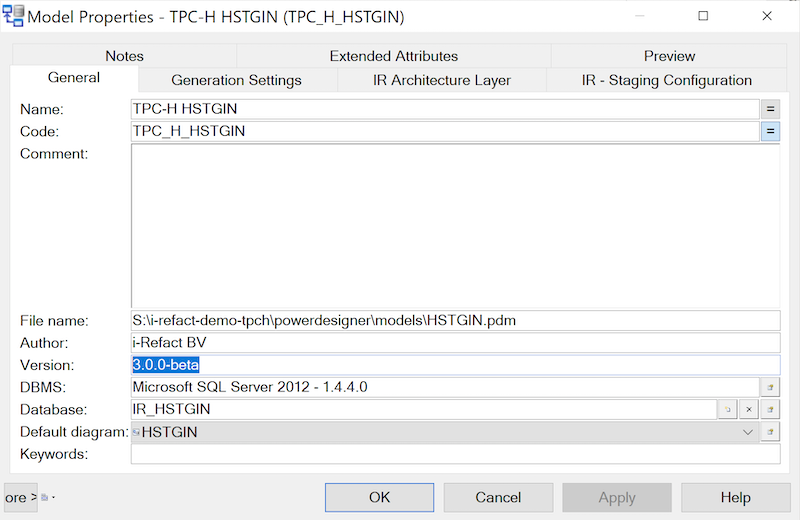
Model Properties - Click on
OK.
It is a good practice to change the model version of every physical data model. The standard for versioning depends on the client. In most cases a version number such as 1.0.0 is used, where the third digit is updated during minor changes and the second digit by major changes.
{info} The model version of the logical validation model is displayed in the i-refactory monitor.